Todd R. Hanneken, St. Mary’s University
Pre-Publisher Research for Brill, The Textual History of the Bible
Volume 3, A Companion to Textual Criticism
Chapter 4, Science and Technology
4.1 Scientific Methodologies and Technology
Modified July 3, 2020
Table of Contents
Spectral imaging facilitates study of manuscripts and other artifacts related to the Bible by expanding the natural color perception of the human eye. Spectral imaging first impacted biblical scholarship by making illegible manuscripts legible, such as gelatinized Dead Sea Scroll fragments or manuscripts that were deliberately erased in order to be reused (palimpsests). Spectral imaging is increasingly appreciated for its ability to capture precise data about the surface appearance of an object. This data can be compared across time for conservation purposes and can create color accuracy not possible with conventional color imaging. As scholars increasingly rely on digital images of artifacts rather than firsthand inspection, and as scholars increasingly appreciate manuscripts as more than just text containers, spectral imaging plays an important role in capturing information that may not be visible in a conventional color image or even firsthand inspection. More than any of the bibliography cited, I am indebted to the contributors to the Jubilees Palimpsest Project for many hours of tutorial, conversation, and brainstorming. Especially worthy of gratitude are Roger Easton, Ken Boydston, Bill Christens-Barry, Ken Zuckerman, Bruce Zuckerman, Mike Phelps, and Keith Knox.
The “spectrum” in spectral imaging is the electromagnetic spectrum, which includes
gamma rays,
x-rays,
ultraviolet,
visible light,
infrared,
microwaves,
radar,
and other radio waves.
The human eye perceives light from violet to red, excluding ultraviolet on one end and infrared on the other.
Within that range, the eye has receptors for blue, green, and red.
All the colors we see are combinations of intensities of those three types of receptors.
“Color blindness” is the condition of having less than three types of receptors.
Monochrome (black and white) photography pays attention only to intensity within the visible range without distinguishing color.
Conventional color photography approximates the three bands of color resolution natural to the human eye.
Spectral imaging diverges from conventional color resolution with the addition of bands outside the visible range or increased resolution within the visible range.
Spectral imaging includes simple spectral imaging, multi-spectral imaging, and hyper-spectral imaging.
Simple spectral imaging uses a single non-visible band and was most influential in the twentieth century in the form of infrared photography.
Infrared photographs of the Dead Sea Scrolls taken in the 1950s remain valuable for scholarship because they were captured earlier in the period of degradation in modern hands.
Bruce Zuckerman,
“Bringing the Dead Sea Scrolls Back to Life: A New Evaluation of Photographic and Electronic Imaging of the Dead Sea Scrolls,”
Dead Sea Discoveries 3 (1996): 187–207.
Greg H. Bearman, Stephen J. Pfann, and S. Spiro,
“Imaging the Scrolls: Photographic and Direct Digital Acquisition,”
in The Dead Sea Scrolls after Fifty Years: A Comprehensive Assessment,
ed. Peter W. Flint and James C. VanderKam (Leiden: Brill, 1998), 472–95.
Multi-spectral imaging resolves more than three bands (most often 10-20) within and adjacent to the visible spectrum.
Multi-spectral imaging became much easier with the advent of digital photography.
Digital multi-spectral imaging was pioneered with the Archimedes Palimpsest Project and contributed more to the interest of biblical scholars through the Sinai Palimpsests Project.
Roger L. Easton and William Noel,
“Infinite Possibilities: Ten Years of Study of the Archimedes Palimpsest,”
Proceedings of the American Philosophical Society
154 (2010): 50–76.
“Sinai Palimpsests Project”
Accessed March 27, 2020,”
http://sinaipalimpsests.org/.
Hyper-spectral imaging resolves hundreds of bands of light by capturing one line at a time and using a diffraction grating to separate light according to wavelength.
Cerys Jones et al.,
“Understanding Multispectral Imaging of Cultural Heritage: Determining Best Practice in MSI Analysis of Historical Artefacts,”
Journal of Cultural Heritage 2020, n. 1,
https://doi.org
Adjacent technologies include magnetic resonance imaging (MRI) and reflectance transformation imaging (RTI).
One of the earliest successful applications of these technologies recovered internal structure and writing from the Antikythera Mechanism.
Daryn Lehoux,
“Ancient Science in a Digital Age,”
Isis 104 (2013): 111–18.
MRI scans create three-dimensional images of density beneath the surface.
They excel at distinguishing metal from organic material.
In the case of the Ein Gedi scroll, metallic ink could be distinguished from carbonized parchment.
The scroll could not be physically unrolled, but the three dimensional data could be virtually unrolled into a two-dimensional readable image.
Michael Segal et al.,
“An Early Leviticus Scroll from En-Gedi: Preliminary Publication,”
Textus
26 (2016): 29–58.
William Brent Seales et al.,
“From Damage to Discovery Via Virtual Unwrapping: Reading the Scroll from En-Gedi,”
Science Advances
2 (September 2016): e1601247,
https://doi.org
The capture of spectral data requires discriminating a narrow range of wavelengths within the electromagnetic spectrum,
as opposed to the broad range of wavelengths in sunlight or artificial “white” light.
This discrimination of narrow bands of light can occur with filters between the object and the sensor,
or prior to reaching the object.
This can be done with filters on the lights or with lights that only produce a narrow range of wavelengths.
The former was popular in the twentieth century.
The latter became possible with the availability of inexpensive narrowband light emitting diodes (LEDs) in the twenty-first century,
and is preferred in as much as it generates less heat and exposes the artifact to less radiation.
For a much more detailed and practical survey of the variety of procedures for multi-spectral data capture and processing,
along with an extensive bibliography of projects and procedures described in print, see
Cerys Jones et al.,
“Understanding Multispectral Imaging of Cultural Heritage,”
Journal of Cultural Heritage 2020,
https://doi.org
Multi-spectral imaging captures the interaction between light and the artifact in three modes: reflectance, transmission, and fluorescence. These three modes can be thought of as three different “responses” that a spot (pixel) on the surface of an artifact might have when struck with light. The surface may reflect the light, causing the light to bounce off diffusely so some reaches the camera sensor. The surface may transmit the light, letting the light pass through it to a camera sensor on the other side. The surface may fluoresce, meaning it absorbs the energy of the light and releases it (glows) at a longer wavelength discerned by the camera. If the surface at that pixel absorbs and retains all the light energy as heat it will appear black in all modes (but consider also the adjacent technology of thermal imaging).
Reflectance, the measure of light reflected from the surface at each wavelength, most resembles conventional photography.
By definition, a red ink will reflect more light of the red wavelengths than the blue or green wavelengths.
Reflectance can be useful for studying biblical literature when the range or resolution of wavelength discrimination surpasses the human eye.
Keith T. Knox, Roger L. Easton, and Robert H. Johnston,
“Digital Miracles: Revealing Invisible Scripts,”
in The Bible and the Dead Sea Scrolls: The Second Princeton Symposium on Judaism and Christian Origins,
ed. James H. Charlesworth,
vol. 2 (Waco: Baylor, 2006), 1–16.
Infrared light is outside the human range of color perception.
Inks that appear black (absorb light) in the visible range will reflect light at a certain point in the infrared range,
and that point differs with the chemical composition of the ink (plant based, iron gall, or carbon based).
University of Hamburg Center for the Study of Manuscript Cultures.
“Typology, Classification: Case Study: Hebrew Manuscripts,”
in
“Manuscript Lab.”
Accessed March 27, 2020.
https://www.manuscript-cultures.uni-hamburg.de
Transmitted illumination can distinguish relative thickness of the same material,
the contrast of materials that transmit more or less light,
and the contrast of materials that transmit one wavelength more than another.
The capture of transmitted illumination approximates the information scholars would gather by holding the object up to a light or window.
The biggest difference is that holding an object up to a light is at most possible upon firsthand inspection (conservation permitting).
The capture of transmitted data moves a digital repository of images of manuscripts in the direction of permitting scholarship beyond casual perusal.
The Jubilees Palimpsest Project provides
transmitted visible light images in Mirador
(http://jubilees.stmarytx.edu
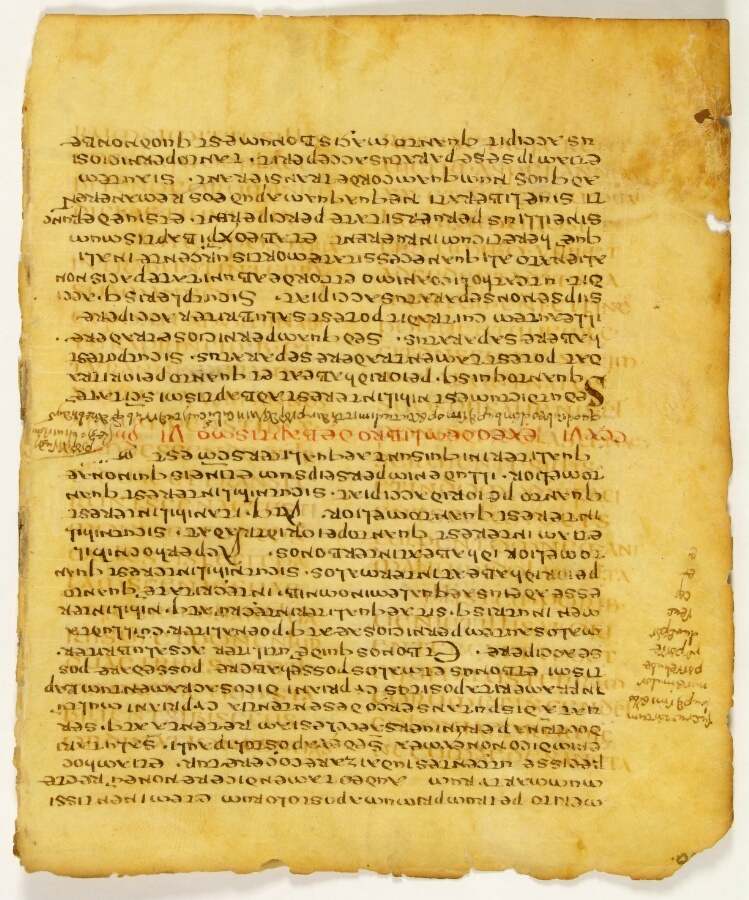
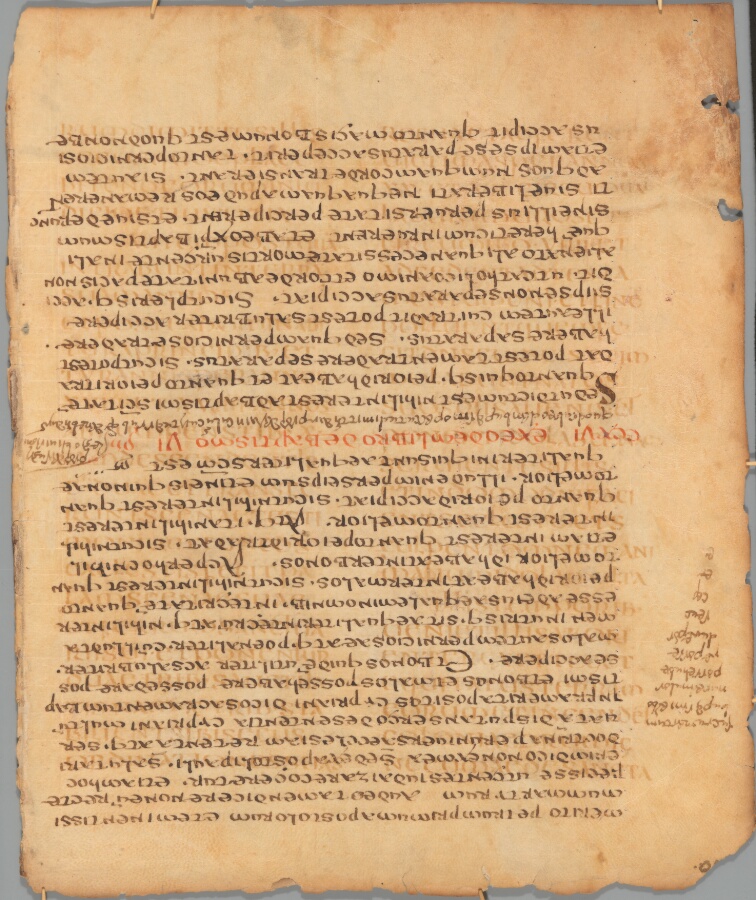
The capture of fluoresced illumination preserves the information previously available to scholars in a reading room using a black light. Black lights are so called because the ultraviolet light they produce is outside the visible range of human perception. However, different materials respond to ultraviolet light differently. When parchment in a reading room or shoelaces in a fun house appear to glow, that is fluorescence. Fluorescence means that some of the light is neither reflected nor transmitted, but absorbed into the material at the atomic level. The energy from that light excites electrons which then create light of a different wavelength. Capture and processing of fluorescence properties of erased manuscripts has been particularly successful. William A. Christens-Barry, Kenneth Boydston, and Roger L. Easton, Jr., “Evaluation and Compensation of Fluorescence for Spectral Imaging of Art Materials and Historical Documents,” ed. Reiner Eschbach et al. (IS&T/SPIE Electronic Imaging, San Jose, California, 2010), 75280M, https://doi.org/10.1117/12.839138. Parchment fluoresces more strongly than ink. Even if the original ink was successfully scraped from the surface of the parchment, slight stains beneath the surface will cause parchment to fluoresce less than where ink had never been. The capture of fluorescence properties requires control of the wavelength used to excite the material, as well as discrimination of the different wavelengths of light produced by the fluorescence. Typically, four discrete wavelengths of light relatively near or far from visible violet light are emitted from the illuminators. Then, filters between the fluorescing artifact and the camera can discriminate the wavelengths coming off or out of the artifact. Specifically, multi-spectral imaging will discern the ultraviolet light reflected (blocking the fluorescence), all light fluoresced (blocking the reflectance), or only the blue, green, orange, or red light fluoresced. Each combination of illumination and filtering requires a separate capture. Four wavelengths of illumination multiplied by seven (six filters and no filter) produces twenty-eight images. Additional captures at different lengths of exposure are appropriate when the dynamic range of fluoresced light exceeds the dynamic range of a silicon sensor. This quantity of data, in addition to the data from reflected and transmitted light, produces a quantity of data too cumbersome for human analysis. Processing is required to find meaningful contrasts in the vast quantity of data.
The capture phase of multi-spectral imaging produces a vast quantity of data representing information invisible to the human eye. The data must be processed and rendered before it can be interpreted by scholars as representing letters on parchment, or similar realia about the physical object. The processing and rendering ranges from simple to complex. Alongside the limitations of the human eye discussed above, spectral imaging is generally limited to the capabilities of a computer screen. In terms of spatial resolution, a high definition screen can represent 4% of a fifty-megapixel image at one time. A screen can represent three color channels (approximating the red, green, and blue receptors in the human eye), a small fraction of the dozens captured of fluorescence, reflectance, and transmission. The intensity of light in each channel is rendered on a scale of zero to 255 (28), roughly a quarter of the degrees of intensity measurable by silicon-based image sensor chips (210), and a tiny fraction of the precision produced by advanced processing algorithms based on many bands of captured data (232). As digital imaging gained dominance in the twenty-first century, numbers represented the intensity of light from each pixel in each mode. The “big data” produced by digital capture could be processed using advanced mathematical algorithms. The processed data could be rendered on screen in a simplified form, allowing a scholar to see contrasts such as the slightest trace of ink on parchment.
The simplest level of processing renders a grayscale image from a single capture.
Often enough, a single wavelength of infrared or ultraviolet fluorescence will suffice to distinguish an erased mark from parchment.
The light reflected or fluoresced can be rendered analogously as white, which can be easily perceived by the human eye.
This level of spectral imaging was widespread before digital imaging.
Another simple rendering technique, called Pseudocolor, renders luminosity of any one image not as white but as one of red, green, or blue.
Jones et al. prefer to call this process “false color” and reserve the term “pseudocolor” for the use of look up tables (LUTs) to falsely color luminosity data from a single image,
“Understanding Multispectral Imaging of Cultural Heritage,”
Journal of Cultural Heritage 2020, 7
https://doi.org
A more advanced technique applies basic math (addition, subtraction, multiplication, division) on the numerical values of each pixel in two images to produce a third image.
The ratio of light reflected in infrared to light fluoresced from ultraviolet may highlight a contrast more clearly than either image alone.
This basic math is trivial on digital data, which already exists as numbers.
Keith T. Knox,
“Image Processing Software for the Recovery of Erased or Damaged Text,”
Manuscript Cultures 11 (2016): 63–72.
Remarkably, this level of processing was anticipated in the nineteenth century using much more cumbersome techniques.
With half-silvered mirrors and multiple exposures on positive and negative photographic plates, the same basic effects could be achieved.
Processing based on alignment of multiple exposures was first introduced in 1894 by Ernst Pringsheim in collaboration with Otto Gradenwitz.
See
Chiara Faraggiana di Sarzana,
“La fotografia applicata a manoscritti greci di difficile lettura:
origini ed evoluzione di uno strumento di ricerca e i principi metodologici che ne regolano l’uso,”
in El palimpsesto grecolatino como fenómeno librario y textual,
ed. Ángel Escobar Chico and Dieter Harlfinger,
Colección Actas
(Zaragoza: Instituciòn “Fernando el Católico,” 2006), 65–80, here 69.
https://ifc.dpz.es
The highest levels of processing available today could never be matched with half-silvered mirrors.
For a more technical description of the difference between the simpler “deterministic” methods described in the previous paragraph and the “statistical” methods described in this paragraph, see
Easton and Kelbe, “Statistical Processing,” 38–45.
Mathematical algorithms have long been used to find patterns and reduce redundancy in large data sets.
Linear transformations such as Principal Component Analysis and Independent Component Analysis
work well with the massive data sets produced by spectral image capture.
These linear transformations can process much more data than human perception could grasp.
Linear transformations such as Principal Component Analysis often give good results with relatively little user input.
Methods that require little user input are called “unsupervised” in contrast to methods that require human “supervision” or input to define classes such as parchment, undertext ink, and overtext ink.
The extra work of training the algorithm combined with non-linear transformations can lead to better results.
See
Corneliu T. C. Arsene, Stephen Church, and Mark Dickinson,
“High Performance Software in Multidimensional Reduction Methods for Image Processing with Application to Ancient Manuscripts,”
Manuscript Cultures 11 (2016): 73–96.
They are effective at producing images that represent the greatest contrast, the second greatest contrast, the third, fourth and so on for as many images as were captured.
In the case of a palimpsest, the greatest contrast may be between the new ink and the parchment, which is not particularly helpful.
One of the following contrasts, however, will represent erased ink on parchment if that contrast can be detected across the complete set of data.
Note that it is not necessary that any one of those images preserve the contrast, only that a distinctive fingerprint of one material over another can be detected across all the images.
Two browns may be indistinguishable to the human eye, but if one reflects evenly across the visible range while the other has peaks and valleys, the algorithm can tell the difference.
It is often the case that a folio consists entirely of shades of brown representing
different kinds of ink, the parchment itself, mold and other stains, and the chemical reagent that former generations of scholars applied in hopes of making folios more readable.
Processing spectral data for accuracy of color may be the least sensational processing technique, but among the most important for scholars and especially conservators. We may think of color photographs today as a big improvement over the earliest color photos and Technicolor movies, but much of that progress is the improved art of illusion. A color camera captures three colors at once using tiny color filters that only roughly approximate the color receptors in the human eye. Digital photography (and before that chemistry) can make those approximations look “pretty” but at great cost to accuracy and consistency. Attempts to calibrate for accuracy of color are subjective and inevitably flawed if the captured data does not correlate with the human eye. The subjectivity and bias involved in photography are problematic in ways beyond imaging manuscripts, as searching the internet for “racial bias photography” will show quickly. Multi-spectral imaging distinguishes not just three but ten or more regions of the visible spectrum. Consequently, the data on light reflected in the visible range are more complete and the final rendering into three colors on a computer monitor more accurate. The accuracy of the computer monitor is another consideration, but as of 2020 even a low-end monitor suffices to show dramatically the difference between accurate color based on spectral data and conventional color photography. Accuracy of color is important to scholars in several ways. For example, if we are comparing folios originally from the same manuscript but now housed and digitized at different libraries, we may miss the similarities in color tone if they were digitized with different color “enhancements.” The enhancements built into cameras today introduce inaccuracy because many humans today find images “prettier” if the colors are more saturated, up to a subjective limit. When such a photo is compared side-by-side with an image processed from spectral data (or firsthand inspection), the “prettier” image looks cartoonish.
Ethical issues in image processing are becoming more important, and scholarly claims that an image shows evidence of text or other information will need to be subject to increased scrutiny.
Most processing to date has been easy to assess.
Images processed by scientists who do not read ancient languages and have no stake in scholarly arguments can be seen as reliable.
Techniques that apply mathematical formulae evenly across every pixel in an image can be seen as objective if writing appears uniformly across the page.
Controversy begins when images are doctored or drawn on by hand, such as in Adobe Photoshop.
It is clearly dishonest to present an image with hand-drawn characters as if it were created from processing techniques that treated every pixel equally.
However, as long as it is properly acknowledged, there are legitimate scholarly reasons to propose hypothetical reconstructions.
Photoshop can be useful for moving a letter from the same scribe’s hand elsewhere in the manuscript to see if it fits in the space under investigation.
For discussion of both the technique and ethical obligations of using Photoshop for reconstructions of fragments, Dead Sea Scrolls or otherwise, see,
Bruce Zuckerman, Asher Levy, and Marilyn Lundberg,
“A Methodology for the Digital Reconstruction of Dead Sea Scroll Fragmentary Remains,”
in Dead Sea Scrolls Fragments in the Museum Collection,
ed. Robert Duke, Emanuel Tov, and Kipp Davis (Leiden: Brill, 2016), 36–58.
For an application of the technology in a scholarly argument, see
Bernard M. Levinson,
“Refining the Reconstruction of Col. 2 of the Temple Scroll (11QTa): The Turn to Digital Mapping and Historical Syntax,”
Dead Sea Discoveries 23 (2016): 1–26,
https://doi.org
The tools available to scholars for working with spectral images fall into the categories of processing and rendering, with some overlap.
Most processing tools will at least show a result, but perhaps not in the most useful interface.
The most powerful (and most likely to be maintained) tools for processing images of evidence of biblical literature are funded by other industries.
ImageJ owes its existence to the U.S. National Institutes of Health (NIH) for the original purpose of processing data from medical and bio-medical imaging.
Caroline A. Schneider, Wayne S. Rasband, and Kevin W. Eliceiri,
“NIH Image to ImageJ: 25 Years of Image Analysis,”
Nature Methods 9 (2012): 671–75,
https://doi.org
Software for delivering images to scholars for close inspection and study is increasingly challenging.
Even as internet connections and device capability increases, more so does the size of a complete set of spectral image data.
Most scholars will not want to look at every pixel at full resolution for every captured and processed image.
Transferring all the data before starting any work would be cumbersome.
The International Image Interoperability Framework (IIIF,
→)
defines standards that facilitate transferring only as much information as is desired on screen right now.
A broad view of an image can be seen at the resolution required, and zooming in on a portion will transfer more detail only for the region requested.
Another important consideration is that spectral image processing rarely produces a single “magic” image that conveys all the information a scholar might want.
Generally, the enhancement of one contrast comes at the expense of another.
It is important to be able to flicker or fade between images of the same page.
Side-by-side may sometimes be helpful, but more often maintaining the location and changing the rendering will reveal the needed information.
For internet image repositories conforming to IIIF standards, Mirador is currently the most popular visualization environment with the requisite capabilities.
For an example of an instance of Mirador utilizing a multi-spectral image repository, see
http://jubilees.stmarytx.edu